It was suggested to me via a group chat earlier today that the Boston Bruins (12-11-3 through 26 games) need to play .634 hockey to reach 98 points, considered by my colleague to be a safe zone of sorts.
But does it really take 98 points to make the playoffs? Since the current rules went into place in 2005-06, the lowest point total in the playoffs has always been under 98. In fact, the average low in 16 full (82-game) seasons under the current structure is 92.
On the other hand, the average highest number of points over the same span to miss the playoffs is 93. More proof that quirky finishes in each conference can hold cruel ramifications.
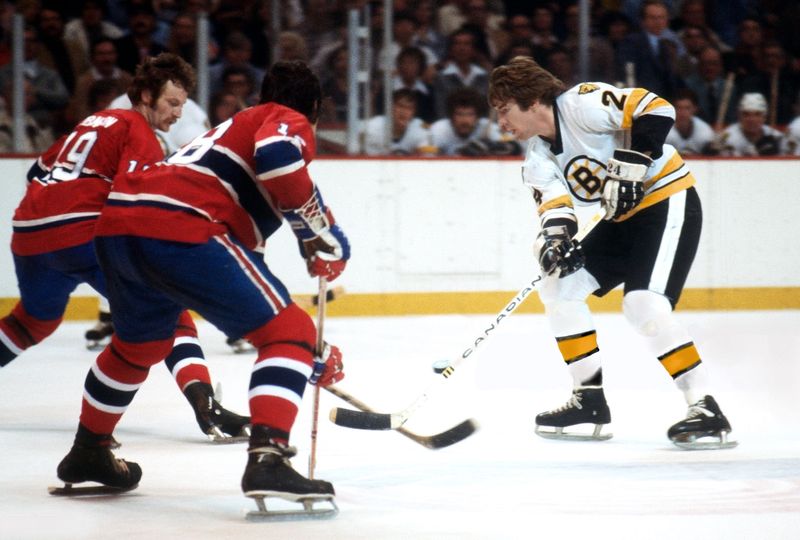
When the 1976-77 Montreal Canadiens of Larry Robinson and Serge Savard (pictured against Terry O’Reilly at Boston Garden) put up 60 wins, they did so without the benefit of regular-season overtime.
The National Hockey League’s 16-team playoff field goes back to the 1979-80 season, in which the four surviving members of the World Hockey Association joined the NHL’s existing 17 teams for form a newly expanded, 21-team league in which “everybody” made the playoffs.
Once the novelty of the expansion/merger had worn off, regular-season relevance was an at all-time low. The dynastic Islanders won the Stanley Cup the first four years of the era but only posted one great regular season, putting up 118 points (54-16-10) in 1981-82 (they were also first overall the season before but with 110 points). Compare that to the four prior seasons in which the Montreal Canadiens won 58, 60, 59 and 52 games during their four-Cup run that closed out the 1970s (the run was 126, 132, 129 and 115 points, the last of the four years one point short of the Islanders for first overall – NYI lost in 6 to NYR in that Cup semifinal; we won’t relive in this space what happened with Montreal).
As an aside, the Boston Bruins’ historic 2022-23 season (65-12-5=135) is often labeled the best record in NHL history. Sorry, it’s not even the best record of the expansion era; that belongs to the 1976-77 Montreal Canadiens, who in two fewer games (80 rather than 82) put up 132 points on 60 wins (without the benefit of regular-season overtime), 8 losses and 12 ties (until the 1983-84 season, regular-season games tied after 60 minutes of play ended as ties). It’s a better record, pure and simple. It’s also the only record in the NHL’s modern era to end with fewer than 10 losses. That is outstanding (oh BTW, the Bruins were responsible for 3 of the 8 but got swept in the Cup final where it mattered most).
The NHL’s announcement that the 1984-85 Edmonton Oilers are the greatest team of all-time is embarrassing to the sport and a shameless reinforcement of its own doctrine first made evident when all NHL teams were ordered to consider No. 99 retired. Many years prior to, an actual player (Jim Schoenfeld) was asked his opinion on retiring sweaters, and his answer was that only one number should be retired and every team should retire it. Wayne Gretzky had yet to play pro hockey, Schoenfeld was talking about No. 4, Bobby Orr.
People are going to have different opinions. Try telling Kevin Stevens that Mario Lemieux isn’t the best player ever to lace up a pair of skates. He’ll have none of it. Point isn’t that I agree with Schoenfeld (even if I do), it’s that the NHL is wrong to tell its benefactors (you, the fans) what you think. That decision belongs to you.
I digress.
Easily the most valuable byproduct of the NHL’s 1990s expansion from 21 teams to 30 (now 32) has been the long sought-after restoration of regular-season relevance. Every game matters, you can feel it in the stress that follows the management teams populating the same elevators used by the media.
Before games, after games, social pleasantries are extremely limited and kept brief and quiet.
Every game matters. That’s the best legacy of the 32-team NHL.
There have been recent musings as to an expanded playoff – the self-loathing NHL can’t help itself when the NBA tries something, it gets dicey around hockey – but thankfully the Board of Governors realizes it would be foolhardy to forfeit the regular-season stress its members strived so many years to achieve.
Now the NHL has it. Regular-season hockey matters. They’ll never be able to bottle playoff emotion, but stress is a yes.
The current system of determining the field for the playoffs via the addition of a shootout to produce a winner in every game goes back to the 2005-06 season coincidental with the beginning of the salary-cap era.
To be certain, the standings and necessary point totals are inflated, which is just fine with the league because it makes teams (and by extension their fans) more encouraged about the prospects of winning. Loser points prop up point totals, keep that evil number of pure L’s to a bare minimum and make it so very few of the 32 have horrible-looking records.
Ironically, it’s the hardest it’s ever been in the NHL to make the playoffs.
Why?
Not because there’s more good hockey and more good teams and more great players but because the playoffs are limited to 50% of the league, the lowest in the NHL’s century-plus of history.
So I no longer begrudge the B.S. standings and win-loss-(tie) columns. The truth comes out in the second week of April.
Here is how I’ve chosen to calculate a team’s season in the cap era:
Assuming an average number of loser points, a team must win more than half its games to make the playoffs. Let’s check out my theory.
Here are, by season, the team(s) with the fewest wins to make the playoffs starting in 2005-06 and excluding the three shortened seasons (2013, 2019-20 and 2021), so it’s an 82-game season in the following 16 cases. (Followed by the team with the fewest points to make the playoffs)
2005-06: Edmonton 41 wins (TB 92 points)
2006-07: N.Y. Islanders 40 wins (NYI 92 points)
2007-08: Nash./Boston 41 wins (Nash 91 points)
2008-09: StL, CLB, MTL 41 wins (Anaheim 91 points)
2009-10: Bos/MTL 39 wins (MTL/Phi 88 points)
2010-11: Buf/Phoenix 43 wins (NYR 93 points)
2011-12: Florida 38 wins (Ott/Was 92 points)
2013-14: Detroit 39 wins (Dallas 91 points)
2014-15: Det/Ott/Pitt/Wpg 43 wins (Calgary 97 points)
2015-16: Minn 38 wins (Minn 87 points)
2016-17: Toronto 40 wins (Calg/Nash 94 points)
2017-18: Phil. 42 wins (Colo 95 points)
2018-19: Colo. 38 wins (Colo 90 points)
2021-22: Was/LA 44 wins (Nash 97 points)
2022-23: Florida 42 wins (FL 92 points)
2023-24: NYI 39 wins (Was 91 points)
Below are the following highest win (and point) totals to miss the playoffs:
2005-06: Van/LA 42 wins (Van 92 points)
2006-07: Colo 44 wins (Colo 92 points)
2007-08: Car 43 wins (Car 92 points)
2008-09: Buf/FL 41 wins (FL 93 points)
2009-10: Calg/STL 40 wins (Calg/STL 90 points)
2010-11: Dallas 42 wins (Dallas 95 points)
2011-12: Dallas 42 wins (Calg 90 points)
2013-14: Tor/Was/Nas 38 wins (Was 90 points)
2014-15: CLB 42 wins (BRUINS 96 points)
2015-16: BRUINS 42 wins (BRUINS 93 points)
2016-17: TB 42 wins (TB/NYI 94 points)
2017-18: FL/STL 44 wins (FL 96 points)
2018-19: MTL 44 wins (MTL 96 points)
2021-22: VGK 32 wins (VGK 94 points) *
2022-23: Buf/Nas 42 wins (STL 92 points)
2023-24: STL 43 wins (STL 92 points)
- 2021-22 is the greatest aberration of the NHL landscape and one that undoubtedly had the commissioner reaching for that bottle of Tums Smoothies. The playoff field was dominated by nine 50-win teams including six in the east (the Bruins were a 51-win wild-card team), where the gap between the 8 and 9 seeds was 16 points … not what the league had in mind.
All of the above only proves there is no guarantee to finish within a certain range of wins or points, especially now that the NHL has further categorized wins for the purposes of tiebreakers. Whereas regulation/OT wins were the first tiebreaker over total wins (including those achieved via the shootout), now wins fall into all three categories, so that regulation wins are now the first tiebreaker.
But, by engaging this overview, one can clearly see that, as noted earlier given an average number of OTL’s, winning over half (42) is the reasonable starting point for playoff expectations. And that’s the point of the exercise, to develop a reasonable sense of expectation/projection.
So, to the point, what does all of this information require of the Bruins?
At 12-11-3 = 27 points through 26 GP, the Bruins have their work cut out. 82 minus 26 = 56 games remaining. To total 42 wins, the Bruins must win at least 30 of the final 56. Since they are currently tied for the most loser points in the Eastern Conference with 3, a fair projection will be 9 for the season. 42 wins = 84 points + 9 OTL’s = 93 points on the basis of a 42-31-9 record. Minus their 12-11-3 start, that’s a 30-20-6 finish (.589 points pct. for the balance of the season).
That outcome, of course, would only get the Bruins into the conversation over the final few weeks of the season. If they’re going to make sure of it, then the .634 points pct. noted up top is more like what it will take to erase any doubt.
